VCL Products > SAN > VCL-SAN, Industrial Grade Storage Area Network
VCL-SAN, Industrial Grade Storage Area Network
with Cybersecurity
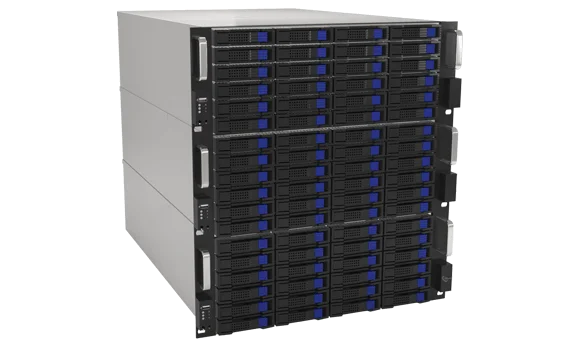
The VCL-SAN is an industrial-grade Storage Area Network (SAN) solution engineered for organizations requiring high-performance, scalable, and resilient storage infrastructure. It delivers enterprise-class performance, fault tolerance, and intelligent data protection for critical environments such as government, financial and enterprise data centers. Each node supports up to 24 × 24 TB drives, offering 576 TB raw capacity per node. Powered by VCL's distributed-storage architecture and managed through the VCL-SAN UI, administrators gain centralized control, real-time analytics, and automated resiliency with Mirrored and Parity-based pools. The system is supplied with a perpetual licence - all software, management, and security features are included, with no annual or recurring fees.